


The ability to understand the fully loaded cost of IT services is a powerful tool in the CIO’s portfolio. Yet surprisingly few IT leaders leverage IT service costing to help their organizations make better decisions around IT investments. Sure, they can tell you how much a server costs or the licensing fees for a piece of software (well, maybe), but can they explain how much it costs to provide end-to-end IT services like Telecommunications, Desktop Services, and IT Security? What about the costs associated with Cloud Computing and the associated value?
In this article, we discuss the key components or “anatomy” of IT Service Costing. Along the way, we delve into hot topics on the minds of IT leaders such as how ITIL 4 practices support IT Service Costing and Financial Management, the impact of Cloud computing, and the advent of complementary approaches such as Technology Business Management (TBM) and Enterprise Service Management. We even sprout out to the history of Cost Accounting (which is thrilling even for non-bean counters). Ultimately, we demonstrate how IT Service Costing can support your organization as it transforms from traditional IT support models to a full-fledged digital business.
Part I: What Are Services, and Why Do They Matter for IT Service Costing?
Services are at the heart, of IT Service Costing. While there are a number of ways to describe a service, let us use the ITIL 4 definition:
A service is a means of enabling value co-creation by facilitating outcomes that customers want to achieve without the customer having to manage specific costs and risks.
Just leave it to the architects of ITIL, those purveyors of linguistic magniloquence, to turn a simple concept into a fustian phrase. In everyday language, services are what IT provides that helps business employees – and in some cases, third-party customers – get their jobs done. To put it in simple terms that everybody can understand, think about going to a restaurant. Sure, you go there because you are hungry and want something to eat. But you also want somebody else to cook the meal for you, want somebody else to set the table, and you certainly do not want to have to do the dishes at the end of the meal. If you are lucky, the restaurant also has great ambiance, possibly live music, a top-shelf wine cellar, and the food is just incomparable. That is what we might call quality of service.
There are times when we do not care so much about the service. We have all been there. You come home from work, and you throw last night’s steak into the oven to warm it up . . . no live music, no witty conversation . . . just a juicy piece of meat (no offense to vegans). The steak is what we might call a product:
A product is a configuration of resources, created by the organization, that will be potentially valuable for their customers.
Consider an IT example of how services and products work together: the “job” that your customer wants to get done is to communicate with somebody else remotely using their voice (the outcome). From an IT perspective, there are multiple ways to accomplish this: landline telephone, mobile telephone, conference calling, internet telephony, voice chat. IT could address this need by creating a Voice Communications Service with landline telephone, mobile telephone, conference calling, etc. as service offerings. As part of the landline telephone offering, IT provides the customer with a desk set telephone (the product), installs or activates a telephone jack or network connection, programs several features into the software of the phone such as voicemail, and provides a telephone number to call to get repair services when the telephone breaks.

Figure 1: Services, Service Offerings, and Products
If services are the heart of service costing, then how come so few organizations define them? “Because it’s hard” is probably too coy an answer, though it is largely true. For services to be easy to understand and useful, they need to be defined not only from the service provider’s point of view; but also from a business or customer perspective. First, focus on what the business or customer needs and how they define outcome. This is something that the service provider cannot accomplish alone. Nor can the service provider speak for the customer. Defining a service is a collaborative effort that must involve the business customer and the service provider.
The Finance Department is often a valuable stakeholder because one of the defining characteristics of a service is that a customer is willing to pay for it. IT Finance is concerned with charging an appropriate amount for the service. When it comes to internal customers, charging a fair amount for the service encourages customers to use services judiciously. When we are talking about external customers, coming up with the right price encourages customers to use our services in the first place and prevents the competition from dissecting our market share.
Far from being an academic exercise, defining services has at least three primary benefits. First, it helps the service provider to understand what the business or customer really wants and shows the business that the service provider has value. Second, it sets the stage for creating a catalog to market services to customers. Third (our focus), it is a precondition for Finance to document value, aggregate costs in a way that the business can understand, and establish chargeback or showback models.
Why should service costing focus on Vital Business Services?
It is a good practice to define all your services – those that support your internal business outcomes – and for service providers that provide services outside of their own organization, those that support external customers. However, in terms of service costing, it is best to focus first on the services that support your vital business services.
Vital Business Services are those so critical to your organization that if they experience an interruption or severe degradation, your business cannot operate or will suffer a significant blow to its reputation. Vital business services support the core services your organization provides. For a hospital, this could be the IT services that support electronic patient records. In a university setting, this could be the IT services that enable the online course management system. For a managed service provider, it makes sense to perform service costing on the most valuable customer offerings so you can determine pricing. For any organization, this could include services related employee safety, Payroll, or services that have a major and direct impact to the bottom line.
Performing service costing can be time-consuming and costly. Few organizations have the expertise or the time to do this on their own; so many hire a consultant to make the process more effective and efficient. Defining and costing vital business services allows you to invest time and money where you will get the greatest benefit in the shortest amount of time. Ultimately, you need to determine at what point the value of the information you obtain from a service costing exercise is worth the investment. It is not necessary to reach a level of scientific precision for every service.
Part II: What are the Components of IT Service Costing?
The Backbone of IT Service Costing is made up of IT assets – the hardware, software, and infrastructure components needed to deliver the service and all associated service offerings. Thus, the IT Asset Management and Service Configuration Management Practices play an important part in supporting IT service costing since we need to identify all the direct and underlying components associated with our services.
IT Asset Management – a sub-practice of Asset Management that has a goal of managing the full lifecycle and total costs of IT equipment and infrastructure. This includes the acquisition, operation, care, and secure disposal of IT assets and critical infrastructure.
Service Configuration Management – has a goal of ensuring that accurate and reliable information about the configuration of services and the configuration items that support them is available when and where needed; including information about how configuration items are configured and the relationships between them.
Take our landline telephone service offering as an example. To deliver landline voice to customers, some typical components are required. These include IP telephone sets, analog telephone sets, various types of headsets, VoIP application, licenses, switches, cabling, PBXs, monitoring software for the Telecom. network operations center, call server, media gateway, and trunks.

Figure 2: Simplified Component Worksheet
What about voicemail? Should the associated hardware and software be included as part of the land-line telephone service offering or accounted for separately? To answer this question, it helps us to think about the concept of core, enabling and enhancing services:
- Core Services are the minimum services you provide to fulfill the customer need. In our example, the ability to speak over a landline telephone is a core service.
- Enabling Services are services that support the core service. Normally the customer does not see or care about the enabling services. But in many situations, you require the enabling services to deliver the core service. For example, to deliver landline telephone service, we need the telecommunications network facilities and any underlying infrastructure.
- Enhancing Services make our core service offerings sweeter. They help to differentiate us from competitors.
Voicemail could be considered either enhancing or core. If voicemail is an optional feature for which you charge extra, you might consider it an enhancing service. You may also think of voicemail as something that comes standard with the landline telephone service offering. In that case, it would be part of a core service. Regardless of the route you take, the components of voicemail should be counted as part of your larger Telecommunications Services.
Components and infrastructure that are shared by more than one service present additional complexity. To continue our telecommunications example, compiling a component inventory was relatively simple in the days of “plain old telephone service.” There were telephones, cables, and lines dedicated to voice communications. Even in the early days of PBX telephony, components were fairly straightforward since telephone equipment and access to the network was largely segregated from other components and infrastructure. As IP telephony has evolved, increasingly telecommunications shares infrastructure with the data network. Many organizations fail to address shared infrastructure at all, which culminates in an artificially low service cost. Other organizations “double count” the cost of shared infrastructure by allocating all of it to each service. Another common approach is to lump all shared infrastructure into one bucket. There is some logic to this simple solution, but the drawback is that it is hard to control costs for anything in the “other bucket” (more on this later). And the tendency is for the “other bucket” to grow and grow.

Figure 3: Allocated Partial Component Worksheet
Generally speaking, the best way to address shared infrastructure is by heuristically allocating a percent of it to particular services. Although this “gut feeling” approach lacks scientific precision, it is often good enough to capture cost and minimize the additional effort and expense it would take to derive a more accurate estimate. As we build out the component worksheet, we add a column to indicate what percent of a component is allocated to the service in question.
It may sound simple enough, but component counting is anything but easy. Just ask anybody who has had to audit telecommunications user licenses and trace them back to a PBX. Or to the IT neophyte who has vainly attempted to figure out how to allocate a server back to ten different applications that are running on it.
To be fair, the components for some services are easy to count. This is true of those that we deliver to our customers via third-party vendors. For example, there may be no hardware or software components to count for a third-party conferencing service like Zoom. This does not mean that there is no cost associated with the service; but it is easier to understand the total cost since we can look at the vendor invoice.
Part III: How Does IT Service Costing Account for Direct Support Staff?
No matter how much technology we use or how much automation we deploy, IT services just cannot be delivered without people. Our direct support staff are the hands to carry out the work of service delivery day in and day out.
Direct support staff are employees whose primary responsibility it is to architect, deliver, or support the service. This includes architects and engineers, systems managers and administrators, installation and customer support technicians, and hands-on technical staff. It is easier to identify direct staff for some services than for others. An imperfect way to determine direct staff is by using the phrase, “They are the __________ person.” For example, “Paolo is the Telecom. guy” or “Francesca works on the virtual server team.” To further develop the Landline Telephone Service example we introduced earlier, it is not difficult to identify the Director of Telecommunications, the Customer Service Manager and her customer service support staff, and the technicians who install phones and perform moves, adds, and change work.

Figure 4: Allocated Partial Component Worksheet Including Direct Support Staff
To reach an accurate service cost, it is important to understand approximately what percent of a staffer’s time is really dedicated to a particular service. For example, in some organizations, a telecommunications customer service specialist may spend 100% of their time answering customer questions about landline service. However, in a different organization, a similar specialist may be tasked with answering questions about landline telephones, mobile phones, and conference calling. In this case, it would be appropriate to estimate how much time the specialist spends working on each service. To be clear, I am not suggesting that the specialist keep detailed timesheets or start a stop-clock each and every time they pick up the telephone to answer a call. A heuristic (best effort) estimate based on several conversations usually suffices.
Part IV: How Does IT Service Costing Account for Shared Staff?
People are the lifeblood of IT services. Put simply, if you were to make a list of all the people it really takes to deliver your IT services . . . even those with minimal interaction with them, the list would probably be a lot longer than you imagine. Quite often, the employees are not always in the same functional department, or they work to deliver multiple services.
Even a fairly straightforward service like Telecommunications often relies on employees who cross functional teams. For example, one of our clients upgraded their telephone systems from “plain old telephone service” (POTS) to a voice over IP service (VoIP). In the POTS days, a telephone technician did not need to have knowledge of the data network or infrastructure. However, as the client entered the VoIP world, the Telecommunications department increasingly depended on the knowledge of network technicians. In turn, the network technicians spent most of their time installing network jacks and troubleshooting network issues. They only dedicated part of their time to assisting Telecommunications. Nevertheless, an accurate service costing exercise means that their time must be accounted for in the model.

Figure 5: Allocated Partial Component Worksheet Including Indirect Support Staff
Perhaps the most often forgotten employees when performing service costing are shared administrative staff positions. Yet, any leader who has been fortunate enough to have a great administrative assistant knows they are worth a treasure in gold. As many businesses have roughed financial downturns over the last decade, administrative staff has dwindled. At the same time, executive assistants are asked to do more and more. It is not uncommon for one secretary to work for three or four or even five departments. Once again, failure to account for these positions means undervaluing our service. Similar to the network technician example above, the best way to account for shared administrative positions is to heuristically estimate how much effort goes into supporting each department and/or each service, always careful not to under-count or double-count. Initial estimates need to be refined as you become better at performing service costing.
Part V: How Does the Financial Accounting System Support IT Service Costing?
An organizational financial accounting system is the brain of comprehensive IT Service Costing. In this case, when we say “system,” we refer to both the coordinated way accounting is handled as well as the financial management platforms and software that supports it. To better understand IT Service Costing and its building blocks, it helps to review the evolution of accounting approaches with a brief history.
Climbing the Beanstalk: a Brief History of Cost Accounting
The origins of cost accounting are as dubious as Jack climbing his mythical beanstalk. In all likelihood, since the advent of beans (probably somewhere between 6,750 B.C. and 9,750 B.C., in case you wanted to know), humans have wanted to count (and eat) them. In our brief history below, we highlight some (but not all) of the important developments.
1500s – Cost Finding
Many accounting historians trace cost accounting back to Medieval (15th century) cloth manufacturers in Florence, Italy. The Florentines (specifically, Medici Industrial partnerships) purchased raw wool and silk and farmed out production work to craftsmen who worked from home. Various stages of production were performed by different craftsmen and different guilds, who charged different prices for their labor and produced different quantities of cloth. To obtain a more accurate cost picture, the Florentines needed to record the various quantities and prices charged for cloth woven by different craftsmen and guilds. They did so to calculate what they should charge for a finished cloth item. Although they were conscious to some degree of fixed and variable prices, it is still premature to call this total cost accounting since they did not account for overhead costs. Since the craftsmen used their own tools, the purchasing company was not concerned about how much it cost the laborer to produce.
1772 – Father of Cost Accounting
The next milestone occurs in 1772 in the U.K. when the “Father of Cost Accounting,” Josiah Wedgwood, started to run into tough times. If the surname sounds familiar, that’s because it is. This is the same Wedgwood who started a pottery company that today produces some of the most exclusive china in the world. (Fun fact: Josiah Wedgwood also happens to be the grandfather of Charles Darwin.) The depression of 1772 meant that demand for pottery fell and inventory was growing dusty on the factory shelves. Wedgwood was trying to avoid bankruptcy, so he began to develop a deep understanding of the cost elements involved in producing pottery. In other words, he became a sort of self-taught accountant. (Along the way, he discovered that his chief clerk was embezzling.) Wedgwood learned the cost of materials needed for each stage of production. He also tried to account for the cost of shipping and inevitable breakage – in other words, “overhead.” He realized that some pieces of china were significantly more expensive to produce than others. Some employees were also significantly more experienced and skilled than others, and Wedgwood’s observations ultimately led to differential pay and specialization by skillset. More than anything else, Wedgwood uncovered the tight coupling between supply and demand. By understanding how much different pieces of pottery cost to produce, he could determine how much to charge. In turn, he started to use price as a way to influence demand for two lines of pottery and effectively segment the market into wealthy consumers who wanted high-quality pottery and less affluent customers who could only afford less expensive, lower quality pottery. (ITIL enthusiasts will recognize in this how understanding patterns of business demand helps IT to plan for capacity and influence customer demand through pricing and chargebacks.) Wedgwood was one of only about 10% of firms during the Industrial Revolution that survived through at least the 1840s.
1830s, 1840s, 1850s – Enter the USA
In the United States from the 1830s through the 1850s, similar cost account developments were taking place. Notably, the Lowell cotton textile mills consolidated and integrated all the means of production. Due to falling prices and foreign competition, Lowell refined cost accounting procedures to determine appropriate market prices. They also relied on cost accounting data to make operational decisions. Mill overseers acted as foremen and were responsible for day-to-day operations. This included understanding profitable and wasteful aspects of mill processes. (As an aside, although it would be anachronistic to refer to this as value stream mapping or “lean,” some of the precursors to lean thought already existed at this time such as identifying waste and using interchangeable parts.)
In the 1830s and 1840s, the Springfield Armory is often considered to have had the most advanced accounting system up to that time. Initially, Springfield’s accounting was architected as a way to summarize financial transactions, track inventory flows, and install individual employee accountability for the work they performed. They used “chart and discharge” accounting, which meant maintaining detailed records of the cost and inventory of raw materials, work-in-progress, and completed items. In addition to tracking the cost of raw materials and value-added/processed inventory, their accounting system was critical to payroll. On a monthly basis, they tracked workers by name, the piece-rate for each task performed (early on, workers set their own piece-rate), and the type and quality of work. They used “piece rates” to incentivize individual workers to produce greater quantities. The flaw in the Springfield system had less to do with their approach to cost accounting and more to do with organizational and cultural factors. In the early days, despite piece rate incentives, the Armory was plagued by workers who would drink alcohol on the job (which sounds like an especially bad idea in a place where weapons are made!) and spend significant time socializing and not working (Can you only imagine if social media existed back then!). Civilian control was not effective in altering employee behavior. After 1840, Springfield placed governance of the factory under military control and benefitted from an influx of Westpoint graduates who understood cost accounting but were also able to exercise a greater degree of discipline over laborers.
In the United States, the Railroad industry contributed greatly to cost accounting. As late as the mid-1800s, corporate financial reporting and auditing were immature, so railway companies needed to devise their own best practices for operating. The accounting principles and formulas they created later served as the basis for accounting in other industries despite flaws or “accounting errors.” In particular, early on, railroads did not appropriately account for depreciation and non-cash expenses. Even so, companies like the Baltimore and Ohio railroad were early thought leaders and practitioners of governance and auditing.
Around the same time, in the U.K., the Regulation of Railways Act of 1868, required British railroads to use the double account method. This method splits the balance sheet into current and long-term asset categories. In the case of the latter, if an asset was maintained and kept in working order, it was considered a long-term asset and no depreciation was charged. Instead, replacements and maintenance costs were expensed (i.e., Replacement Accounting).
Back in the U.S., the Pacific Railway Act of 1862 authorized the construction of the Transcontinental Railroad, and as early as the 1870s railroad construction took off. However, post-bellum railroads were not very profitable largely because they did not understand the relationship between short-term profits and long-term costs. Railroads and equipment need to be maintained constantly and over the long-term, and this amounts to no small expense. Enter Albert Fink, a German-born engineer and superintendent of the Louisville and Nashville Railroad. Fink introduced a cost-analysis system to measure railroad operations efficiency and profitability. At the time, his thoughts on fixed and variable costs and costs assigned to multiple account periods were innovative. He also devised a version of what we would today call “unit costs” by calculating profitability and expense per ton-mile and by passenger-mile. In short, Fink’s cost management techniques led to the management axiom of “control through statistics” and earned him the moniker, “Father of Railroad Economics.”
1890s – “Scientific Management” and Frederick Taylor
Frederick Winslow Taylor earned his reputation as the father of “Scientific Management” largely due to his studies of efficiency and task standardization. But his contribution to the history of accounting is no less monumental. Taylor borrowed many of his accounting concepts from the railroads and improved upon them. Taylor’s main focus was on providing accounting information useful in management decision-making. As such, he was concerned with obtaining copious amounts of information about items important to making business decisions. At the same time, he strongly advocated eliminating items that were not useful in decision-making, the nineteenth century version of what we call “noise.”
Taylor used several journals and ledgers to gather and consolidate cost information into the smallest number or headings or categories possible without compromising understanding of what the expense items actually meant. These individual ledgers were then posted to the general ledger on a monthly basis. At the risk of oversimplifying, Taylor’s work led to the introduction or improvement of concepts such as: chart of accounts, general ledger, tracking of Sales expenses, general shop expenses, open accounts, depreciation, valuation of work-in-progress or inventory, and register of accounts. Perhaps more important, Taylor’s focus on “useful” information encouraged Planning department activities to become more closely integrated with General Accounting. It also supported an “interlocking system” where costing is integrated with general accounting systems. Ultimately, “Taylorism” represented something of a transition from an era of incomplete cost accounting and evolved into what we might call “managerial accounting,” where the emphasis is placed on tracking information to support decisions.
1920s – “Modern Industrial Cost Accounting”
Building upon Taylor’s insights, the 1920s saw a substantial increase in the professionalism of accounting and the “Modern Industrial Cost Accounting” era began. Significantly, in 1921, a CPA from Chicago, J.O. McKinsey (the founder of McKinsey and Company) wrote a series of nine articles describing the benefits of creating a master budget and “business budgeting.” He described what we now know as governance by promoting the importance of having a budget committee along with associated roles and responsibilities.
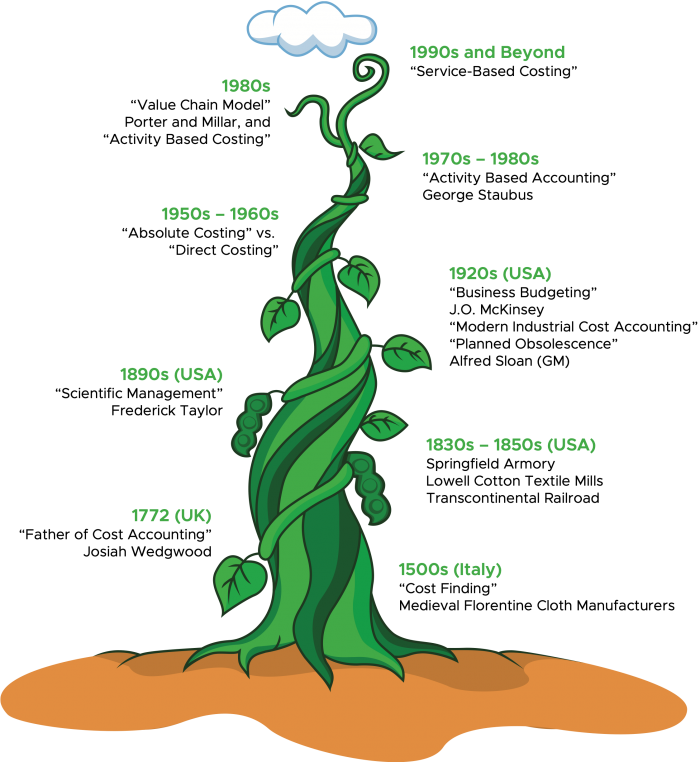
Figure 6: A Brief History of Bean Counting
For his part, Alfred Sloan worked his way up the corporate ladder to become the president of General Motors in 1923. He introduced the idea of “annual styling changes” to the automobile industry. In essence, he introduced slight cosmetic changes to automobiles on an annual basis to highlight the newness (or oldness) of an automobile and thus encourage people to update their car just as they would update their clothing based on changing fashions. Another way to say this is “planned obsolescence.” He relied heavily on uniform accounting procedures to manage a decentralized company. His goal, which he called “the ladder of success,” was to create a suite of auto brands under GM, each successively more luxurious than the last, to encourage customers to stay within the GM family but purchase increasingly more expensive cars. He needed accurate and highly-detailed cost accounting information to facilitate this brand segmentation since it was based on alternating pricing based on cost and sales predictions.
1950s, 1960s – Absolute Costing v. Direct Costing
The only thing more ferocious than a battle between academics is a war between accountants. Thus, the proponents of absolute costing parried against the janissaries of direct costing.
In absolute costing, both variable and fixed production costs are considered product costs. Product unit cost includes direct materials, direct labor, and variable and fixed overhead. Fixed and overhead costs associated with manufacturing are allocated proportionally to the cost of each unit.
In Direct costing (also known as marginal costing), costs that vary depending on the output are considered as part of the product cost, whereas fixed manufacturing cost is not. Absolute costing advocates contended that excluding fixed manufacturing costs would artificially undervalue inventory. Direct costing supporters believed that absolute costers allocated fixed manufacturing costs on an arbitrary basis to product costs and therefore did not arrive at a true product cost.
As with most arguments, over time, the reasons for the quarrel often disappear. In today’s world, computers and accounting systems allow companies to effortlessly maintain both absolute and direct costing systems.
1970s, 1980s – “Activity-Based Accounting” and George Staubus
Activity-Based Accounting or costing (ABC) is largely based on the work of George Staubus, who researched Activity Costing and Input-Output Accounting. ABC became popular in the manufacturing sector based on a recognition that knowing the cost of simple components or inputs does not provide an accurate overall cost picture. Instead, ABC “identifies activities and allocates the cost of each activity with resources to all products and services according to the actual consumption by each.” The ABC model is an advancement over conventional costing because it accounts for indirect or overhead costs and associates these with direct costs to gain a more comprehensive cost picture. ABC can be applied to both products and services and help managers understand profitability. It also helps managers determine ineffective processes used to deliver products or services.
1980s – “Value Chain Model” and “Activity Based Costing”
In 1985, famed professor, Michael Porter, introduced the idea of the value chain model in his book, “Competitive Advantage.” The value chain is made up of all the activities that an organization undertakes to deliver outcome or value to the customer. (In fact, this is essentially the way ITIL 4 describes value in the Service Value Chain concept.) Porter divided these activities into Primary and Support. Primary activities include inbound logistics, outbound logistics, operations, marketing and sales, and service. Support activities include Procurement, Human Resources, Technology Development, and Infrastructure.
Meanwhile, activity-based costing remained popular throughout the 1980s.

Figure 7: Generic Porter Value Chain
1990s and Beyond – “Service-Based Costing”
In the 1990s, Activity-Based Accounting started to fall out of favor, largely because companies found it too difficult or expensive to implement. Likewise, Kaplan’s Balanced Scorecard started to gain momentum and then waned. Although Balanced Scorecard takes a holistic approach, it, too can be difficult and time-consuming to implement.

Figure 8: Balanced Scorecard Example
Service-Based costing emerged as a viable alternative to both of these. In Service-Based costing, services are defined first based on desired customer outcome. Then, all activities, components, resources, and overhead are valued and taken into account.
Although Accounting has changed over time, throughout its entire history, the general trend is towards a more holistic approach to understanding the full cost to produce a product or provide a service. The first early breakthroughs in cost accounting attempted to inventory and value all components of production. But there was a recognition that total cost is more than the sum of the components. Driven by necessity and propelled by crisis, the best businesses found ways to navigate financial depressions, outwit competition, and adjust to rising material prices. Key to all success stories is the impulse to count anything you wish to control and eliminate anything that is wasteful. For example, large “other” categories should be eliminated to the extent possible when performing service costing.

Figure 9: Financial Accounting
What are the ABCs of Financial Accounting Systems?
But why is comprehensive costing so important to us and what do we need financial accounting systems to do for us? At a minimum, we need our financial accounting systems to do three things for us: Accounting, Budgeting and Charging.
Accounting is concerned with historical information. It lets us know how much we spent on something. In the ITIL publications, it is defined as “The Process responsible for identifying actuals Costs of delivering IT Services, comparing these with budgeted costs, and managing variance from the Budget.” Without good accounting, we cannot budget accurately nor can we charge fairly or profitably.
Accounting involves at least two basic (but not simple) activities: Cost Typing and Cost Classifying.
Cost Typing means grouping types of costs into categories, putting the beans in the right buckets. For example, a few common IT cost types include: Hardware, Software, and Salaries.
Cost Classifying addresses the end purpose of the cost. Typical cost classifications are: capital, operating, direct costs, indirect costs, fixed costs, and variable costs.
For comprehensive IT Service Costing to work, before performing cost typing or classifying, service recording should be done. That is, what a service is (and what it is not) and all of the aspects (people, process, and technology) should be identified before allocating costs.
Budgeting enables an organization to plan future IT expenditures based on knowledge of actual costs and information we have on likely increases or decreases in future cost. Effective budgeting helps reduce the risk of over-spending. It also helps prevent the organization from “penny pinching” too much and approaching spending too conservatively. Formally, ITIL defines budgeting as, “The Activity of predicting and controlling the spending of money. Consists of a periodic negotiation cycle to set future Budgets (usually annual) and the day-to-day monitoring and adjusting of current Budgets.”
Charging is the third component of IT Financial Management. Charging is simply recovering the cost of delivering IT services. Not surprisingly, when an organization does not really understand what services it is providing or how much they cost, charging becomes a mystery; reach into the top hat and pull out a price tag and hope that the customer is willing to pay. The reality is that many organizations treat IT as an internal or shared service provider. In other words, IT is a cost center that the business funds at a high level; in turn, IT does not charge back for services. Even if this is the case in your organization, the inability to describe costs in terms customers can understand (i.e. valuable services) makes it difficult to justify IT budgets. Some savvy IT shops do something called “notional charging” or “showback.” Essentially, no real funds change hands between the business and IT. However, IT provides a dummy invoice to the business detailing how much it would have cost had the business been an external customer. In an organization that is not fully digitalized, I am personally not a fan of “notional charging” per se. It sounds too much like saying “I told you so.” On the other hand, I strongly support close communications between IT and the business; and in budget conversations IT should have concrete evidence to demonstrate how much it costs to offer various services.
For managed service providers, knowing comprehensive IT service cost is even more critical. It is the only basis to know how much to charge for a service and to still remain profitable.
The Ecosystem of Financial Management Platforms
No discussion of IT Financial Management or FinOps is complete without addressing financial accounting systems. Although there are many robust systems on the market, not all financial accounting systems are created equal. There are basically two types of systems on the market: Enterprise Resource Planning (ERP) systems and IT Financial Management Systems.
Most sizeable organizations are likely to have an ERP system (e.g., SAP, PeopleSoft, etc.). The range of functionality offered by ERP systems is large. At a basic level, ERP systems integrate back-office processes and act as big relational databases that aggregate information from various business processes so they can be recombined and repurposed. For example, an invoice processing/Accounts Payable module of an ERP system allows you to code and record invoices from vendors and have checks issued. The information from recording the invoice can then be used as input for specific departmental budgets, reports on expenses by vendor, or by category. A big benefit of ERP systems is that they make managerial reporting easier and timelier, and they help make accounting more accurate. Since the scope of ERP systems is large, they tend to focus on basic accounting and not service accounting.
By contrast, IT Financial Management Platforms or Systems tend to be narrower in scope and focus on running IT as a business. Many of them support accounting, budgeting, and charging processes. Some even help to reconcile and process vendor invoices. The best of the IT Financial Management Platforms help to define lines of business. For example, a hospital may be interested in how much IT is dedicated to supporting in-patient care. At the service level, a good IT Financial Management platform could also tell how much IT is supporting Clinical Applications Services.
One of the most popular IT Financial Management Platforms on the market is Apptio, which provides software that can help an organization not only with technology financial management but also with cloud financial management, and enterprise planning. The Apptio platform is based on the Technology Business Model (TBM), an approach to financial management that Apptio created with the nonprofit TBM Council.
Other popular IT Financial Management Platforms include: Flexera IT Financial Manager, UMT360, and Microfocus IT Financial Management.
At the end of the day, ERP systems are not better than IT Financial Management Platforms nor vice versa. Both systems simply have different scopes and different goals. Quite often, both systems work together. In fact, this is an ideal situation.
What to Look for in Good IT Financial Management Platforms
If you are a medium to large organization, the likelihood is that you already have an ERP system. But ERP systems are usually configured to perform cost item or component costing; not service costing.

Figure 10: Component Costing
By contrast, a good IT financial management platform interfaces with your ERP system or makes it easy for you to manually input data from your ERP system. More importantly, a good IT financial management system is built around service recording and service taxonomy concepts. In other words, the system understands that components and even cost items are just the tip of the iceberg when it comes to services. A good system is structured around a comprehensive understanding of services.
Good IT financial systems also provide multiple views and dashboards. For example, maybe your CIO is interested in knowing how much you are spending on the Information Security Management Services; but she also is concerned about how much IT is spending in aggregate on software, licenses, hardware, personnel, etc.
If your IT financial management system is at all integrated with your IT Service Management platform (e.g., ServiceNow), so much the better. Comprehensive IT service costing is greatly supported when you have an up-to-date asset register to track component inventory and when Service Asset and Configuration Management is being performed and maintained. In other words, if you know which physical assets you have and how they relate to each other, to the services they support, and to the people who maintain them, performing comprehensive IT service costing is much easier and more accurate.
How Does a Service Catalog Support IT Service Costing?
A final note on IT financial management systems – if you do not already have a service catalog, it is good practice to combine or run parallel campaigns to create an IT service catalog and implement IT service costing. If you already have an IT service catalog and are beginning to implement service costing, be sure to involve both IT and Finance staff. Ideally, service in the service catalogue and Financial Accounting for services should be the same. If a one-to-one relationship is not practical, then strive to get as close as possible.
Finally, hiring a consultant to help perform IT service costing can be beneficial. Costing initiatives can be complex and take a long time. Often, a consultant is in a better position to focus on the work that needs to be done without being interrupted by daily operations and other IT projects. Hire a consultant who has the ability to work seamlessly between the business, Finance, and technical IT. The consultant should be able to sort through financial reports and even invoices (if necessary). Be cautious, however, that the consultant really understands service costing and doesn’t simply count beans and putting them in different buckets.
Part VI: How Does IT Service Costing Deal with “Other” or “Miscellaneous” Cost?
Can you remember back to Anatomy 101? What is the largest organ in the human body? It is a bit of a trick question. It’s not the brain, and it’s not the heart. It is the skin! The average adult has about eight pounds of skin which can be stretched out to about 22 square feet. The fact is that most people get this question wrong. How is it possible to take skin for granted? It is the most accessible area of the body. It surrounds us. It holds the rest of us together. Without it, living is not possible.
So, too, it is with those “other” costs that make comprehensive IT costing so cumbersome because they do not neatly fit into our other buckets.
Ideally, we want to avoid large buckets of “other” or “miscellaneous” costs since they tend to be the first that are hacked away during budget season. Although surgical cuts are sometimes warranted, too often the items in our “other” bucket are not optional; we need them to deliver services.
“Other” considerations include things like overhead, shared salaries, unallocated and incidental costs. Let us discuss each.
How does IT Service Costing Deal with Overhead and Shared Salaries?
To many managers, “overhead” is so bad that it’s like two four-letter words rolled into one. In fact, it is two four-letter words rolled into one. Overhead is the first target for budget cuts. For our purposes, overhead includes facilities and rental space, utilities (light, cooling, heat), and shared salaries. But unless you plan on working in a tent with a laptop wired to an Idaho potato, you need to be located in some sort of office space. Can you imagine servers in your data center sweating because there is no adequate cooling? And what about Ezmerelda and Ivan, the two administrative assistants who support seven directors in charge of twenty-two departments with forty services? Could you really survive without them? Not to mention Jake, Abe, and Ike, who work on the server team and support multiple services.
At some level, you realize that a certain amount of controllable overhead is acceptable. But how do you square this with service costing?
The purist would suggest that you identify every “other” or “overhead” asset and with something approaching scientific accuracy determine the percent of that asset that supports a particular service. For example, Ezmerelda may support Director Bob, who “owns” Telecommunications and Networking Services. If we really looked at how she spends her time, maybe we could determine that over the last six months, she spent 50% of her time on general administrative duties, 20% of her time supporting other departments and services, 20% of her time supporting the Telecommunications Service, and 10% of her time supporting Networking Services. The purist would apply the same precise allocation logic to servers, infrastructure components, rental charges (by amount of space consumed by a particular department), etc.

Figure 11: The Practitioner Approach to Shared Salaries
In rare cases, the purist approach may be the best. More often than not, the purist approach imputes false scientific rigor to the cost allocation process. There are three good reasons why the purist approach should be avoided:
1. It is rarely accurate. I do not know many people who track their time on a minute-by-minute basis. (I knew one guy, an accountant, in fact, who did this. He also used a pedometer and complicated spreadsheet system to track how many steps he took each day for five years and compared his own records from year-to-year and day-to-day. He was a good guy. He was also the definition of a bean counter.) Typically, time allocation is a best guestimate.
2. Situations change. It is also true that situations change. For example, during the last six months, a major telephone system roll-out may have meant that Ezmerelda spent the bulk of her time supporting the Telecommunications Service. But once the system stabilizes, she spends very little time supporting Telecommunications. Or an application that supports a service “lives” with five other applications on a particular server. As demand for the application grows, the application is migrated from a shared server and inherits its own server.
3. Have the right conversation. The purist approach often incites the wrong conversation. To elaborate on our example above, an executive may wonder why during the last six months, an applications manager spent 60% of their time supporting the ERP system without understand that this was due to a major upgrade. A better conversation to have would be around whether the right staffing levels are in place to meet demand and whether the staff have the appropriate skills to execute on our service management processes.
The Practitioner approach is often more reasonable. In most cases, you can arrive at a good heuristic estimate without the time and expense it would take to perform more “scientific” allocation. Instead of guestimating how much time the administrative assistant spends supporting each department or each service, take the total salary and allocate it equally in a straight-line way across all services supported. Adopt the same approach with the CIO salary and with the salaries of leaders in the PMO.
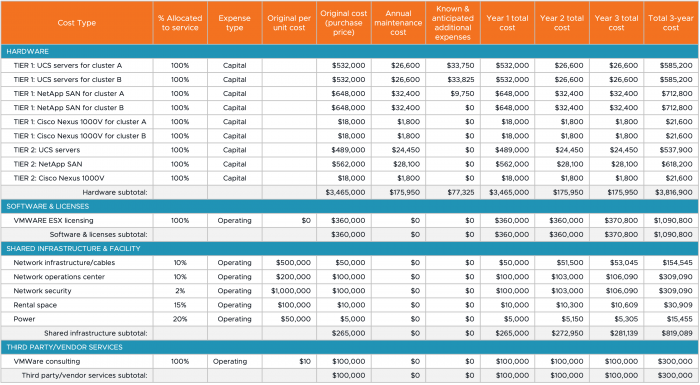
Figure 12: The Practitioner Approach to Allocation and Future Costs
The Diminishing “Other” Bucket, Incidental Expenses, and the 20% Rule
A good goal is to achieve a diminishing “other” bucket over time. However, it may not be possible to completely eliminate it on day one (or ever, for that matter). There may be incidental expenses, small unidentified items, and difficult to categorize costs that need to remain in the “other” bucket. For this category of expenses, I suggest invoking what I call the 20% Rule.
The 20% rule, simply stated:
Whenever an “other” category is less than 20% of the overall budget, leave it alone. Whenever an “other” category is greater than 20%, try to decompose it and allocate the cost items to the appropriate service.
Remember, we make the assumption that the items in our “other” bucket are needed to deliver services. When our bucket approaches or exceeds 20%, executives start to wonder what is in the bucket and begin sharpening their cleavers.
Other IT Service Costing Considerations
There are a few other considerations when performing IT Service Costing:
- Anticipated future costs of services
- Maintenance expenses
- Upgrades
- Fleet replacements of hardware
- Inflation
- Salary increases
- Existing Service Level Agreements (SLAs) with business customers
- Tiered Service Levels, Tiered Service Offerings
Anticipated future costs, maintenance expenses, upgrades, fleet replacements, inflation, and salary increases, at a high-level, all speak to the issue of timing. The best thing to do is to reasonably estimate the amounts associated with these, determine when these costs will hit (or over what period of time), and build these costs into your comprehensive service cost or into your chargeback. For example, if you estimate that over the next three years you will spend $150,000 on maintenance and another $100,000 on upgrades, you should add $250,000 to the total cost of your service. Alternately, you could phase chargebacks so that each year the cost to the business is marginally higher.
Existing Service Level Agreements (SLA) with business customers also need to be factored. Achieving an SLA requires a certain amount of assets (people and technology), each of which has an associated cost. If follows that any changes to an SLA have a direct or indirect impact on your costs. For example, if you initially agree with the customer to restore a service within four hours after failure and subsequently change this to two hours, you will likely need to apply more resources to meet the new service level. In other words, you might consider charging more.
Tiered Service Levels and Tiered Service Offerings can be used to manage customer expectations and to align chargebacks with the level of service provided. In the absence of tiers, customers expect the highest possible service for the lowest possible price. Tiers help give customers more of what they want as long as they are willing to pay for it.
How Does the Rise of Cloud Computing Impact IT Service Costing?
Since it starting to go mainstream only about a decade ago, Cloud computing has had a significant impact on IT service costing, revolutionizing the way organizations allocate, track, and manage costs associated with third-party provisioned IT services. The changes have been largely positive, though there are some negative aspects associated with it. Some of the key benefits include:
- Cost Visibility and Transparency: At least upfront, Cloud computing provides improved cost visibility since cloud service providers offer detailed billing and usage reports. In theory, this allows organizations to understand the costs associated with different IT services and resources. Enhanced transparency enables better cost management and decision-making.
- Granular Cost Allocation: Cloud services enable more granular cost allocation. Organizations can allocate costs based on specific services, projects, or even individual users. This level of granularity enhances accuracy in cost allocation, facilitating better cost control and accountability.
- Pay-as-You-Go Pricing: Cloud computing offers pay-as-you-go (pay-per-sip) pricing models where organizations are billed based on their actual usage of resources. This model can allow for more precise cost allocation, as costs are directly tied to the consumption of services. It provides flexibility in scaling resources up or down based on demand, optimizing cost-efficiency.
- Real-Time Cost Monitoring and Control: Cloud computing enables real-time monitoring of costs, providing organizations with immediate insights into cost trends and patterns. This empowers IT and finance teams to proactively manage and control costs, identify cost-saving opportunities, and make data-driven decisions.
- Shifting Cost Structure: Cloud computing introduces a shift from traditional capital expenditures (CapEx) to operational expenditures (OpEx) models. With cloud services, organizations pay for IT resources on a usage-based or subscription basis, resulting in more predictable and scalable costs. This shift requires adjustments in cost allocation and tracking methods to accommodate the changing cost structure.
- Cost Optimization Opportunities: Cloud computing presents opportunities for cost optimization. Through cloud service management and resource optimization techniques, organizations can identify underutilized or idle resources and make adjustments to optimize costs. This may involve rightsizing instances, leveraging reserved instances, or utilizing spot instances to reduce costs.
Despite the benefits, Cloud computing has introduced some challenges as well. For example, cloud computing can impact the cost allocation of traditional IT infrastructure. With the migration of certain services to the cloud, organizations need to reassess how costs are allocated between on-premises infrastructure and cloud services. This requires a careful evaluation of cost drivers, usage patterns, and appropriate allocation methodologies.
More than this, due to the apparent democratization of technology introduced by the Cloud, it is not uncommon for business units themselves – without consulting IT – to purchase Cloud services for themselves and even on behalf of their customers. Although entry-level cloud offerings tend to be inexpensive (in some cases, free) and uncomplicated, more advanced offerings are more expensive and introduce a certain complexity of cost management. In fact, when business units do their own purchasing of Cloud services, costs tend to creep at first; then burgeon out of control quickly. Far from the “Cloud First” strategies of just ten years ago, recently, there has been a leveling and even decreased investment in cloud services. While this is likely to be short-lived, many organizations are starting to rationalize cloud services to understand what they truly need.
Considering the diverse range of cloud services, providers, and pricing models, organizations must establish robust governance and cost management practices to effectively monitor, track, and optimize costs across various cloud platforms and services.
What is Technology Business Management (TBM) and how does it relate to IT Service Costing?
Technology Business Management (TBM) was created by the nonprofit, the TBM Council, in 2012. TBM is a comprehensive approach to IT financial management that integrates financial management, technology management, and business strategy. At its core, TBM is a framework designed to bring transparency and accountability to technology investments. It enables organizations to gain insights into the cost and value of their technology resources and services. TBM encompasses various dimensions, including financial transparency, cost optimization, value realization, technology portfolio management, and business alignment.

Figure 13: The TBM Framework
Fundamentally, TBM attempts to align decisions about IT investments to larger business strategy. For example, an IT investment question is “Why are we spending $xxx,xxx on the Service Desk and ITSM platform?” A more relevant business question is “What would be the effect on IT support of the business and employee engagement of spending $xxx,xxx on AI and robotic process automation tools to increase service availability and decrease reliance on human agents to resolve incidents and process service requests?”
There are five key elements of TBM:
- TBM Framework – organizational traits, disciplines, and value conversations that comprise the TBM program.
- TBM Taxonomy – common language and structure that normalizes IT-speak and business speak to help IT and the business communicate
- TBM Model – data-driven method used to map and allocate costs and resource consumption from sources to uses.
- TBM Metrics – key performance indicators that help IT leaders to communicate business value of IT.
- TBM System – software and data needed to automate management and analytics.
Regarding the last point, TBM is sound conceptually but only really makes sense when it is put into practice. Thus, robust software is needed to implement TBM in its fullest sense. (It is no coincide that Apptio, the Financial Platform vendor, was a key stakeholder in creating TBM and the TBM Council). Financial Management software allows leaders to produce reports and dashboards and see multiple views of IT financial data. For examples, not only can a leader see how much is being spent on a service, they can also see spend at more granular levels such as per component, per application, per employee. Going in the other direction, executive leadership can aggregate spend at a higher level to understand how much does it take to run the business, grow the business, and transform the business.
Does IT Service Costing also Apply to Enterprise Service Management?
Fundamentally, services are services. Most, if not all, of the basic concepts of IT Service Management also apply to enterprise service management (ESM). This means services in other domains such as Human Resources, Finance, Facilities, Research and Development, and the list goes on. The same is true with IT Service Costing. If you want to get out of the mindset of tracking costs and making decisions based on departments and tools, begin thinking about your intended business outcomes. Increasingly, organizations are taking an enterprise service management approach for services that go well beyond IT. This includes creating ESM workflows/value streams, integrating third-party suppliers, right-sized staffing, and comprehensive service costing.
What are the impacts of Digital Business and Digital Transformation on IT Service Costing?
In fully digitalized organizations where IT is making decisions along with executive leadership, there is no real separation between “the business” and IT. In this case, the primary impact on IT Service Costing relates to chargebacks. In non-digitalized organizations, chargebacks are used as a way to recover funding from business units to fund the maintenance and growth of IT. They are also used as a way to keep the business “honest” by using IT services in a judicious and non-wasteful way. However, if there is no separation between IT and the business, this way of thinking about controlling IT services may well be outdated.

Figure 14: Run the business; Grow the business; Transform the business
For the majority of organizations that have not yet achieved a digital transformation, leaders and IT portfolio managers are concerned with increasingly shifting investments from “Run the Business” to “Grow the Business” and “Transform the Business” portfolios. While “keeping the lights on” is important – especially during a transition to a new business model – investment in digital technologies, Cloud computing, and new ways of working are more important to achieve the desired future state. IT Service Costing allows leaders to understanding what percentage of IT investment is going into each bucket and helps them make decisions about how to move from investing in legacy technologies and approaches to work to investing in resources that support the organization’s vision.
Part VII: Why is an Annual Health Check Important for Service Costing?
There is no need to wait until green patches grow on the skin and stick like glue to assess whether your IT costing initiative is working. An annual health check is just want the doctor ordered in terms of making sure that you are offering the right services for the right price.
Focus first on assessing your vital business services, the ones that the business cannot live without and where IT’s support is most valuable. During the course of the year, did the business’ priorities change? Were lines of service added or retired? What changes occurred in the internal or external environments that impacted the services the business offers to its customers?
If significant changes occurred to the business, engage business leaders to determine whether current IT services are still relevant or whether they need to be modified or retired and what new services IT could offer. Do not be offended if the business suggests retiring a service. It is natural that services wax and wane; some services become less important whereas other become essential.
Another reason to conduct an annual health check is because costs change. Many of us are accustomed to rising prices. After all, when you go shopping, how often do prices actually go down? But this is not always the case with services. It is possible that as IT becomes better at service delivery or as more customers use the services we offer, we could benefit from efficiencies and smarter ways of working and actually reduce costs. If you already factored in multiple-year expenses into service costing and chargebacks (per the previous section), it is still worthwhile to quickly check to see if your estimates were on target.
Remember, this is an annual health check; not a post mortem. Don’t wait for things to go wrong before checking-in. If mid-year something seems awry, spent a short amount of time on testing your observations. For example, if mid-year, key hardware components that support a service unexpectedly rise in cost, you may consider raising the price you charge to deliver the service.
The annual health check is meant to be a quick check-in; not another full-blown comprehensive service costing initiative. The best way to ensure that this is the case is to consider critical success factors and key performance indicators right from the start, when you begin your first service costing initiative. Then, when you perform the annual health check, you can focus on a few important areas; not reinvent the wheel.
Follow Your Own Star!
In the preceding pages we have discussed seven key components of IT Service Costing and provided a rough outline of steps to follow to improve your organization’s ability to identify, track, and make decisions. Although the journey is not easy, the benefits of putting in place IT Service Costing outweigh the risks and work that needs to be put in upfront. There is no one prescriptive path to success, and there are no reasons to delay. To quote a favorite poet, “Follow your own star!”